The Impact of Data-Driven
Sales Solutions
How to deploy a Commercial & Sales Dashboard using Power BI with Agile project methodologies,
allowing daily access for 440 users.
Welcome! I am a Senior Data Analyst skilled in Python, MySQL, MS SQL Server, Power BI, Tableau, Kettle, and Talend.
My goal is to bring value through insightful data analyses and provide actionable
strategies to help others to make data-driven decisions and to improve business results.
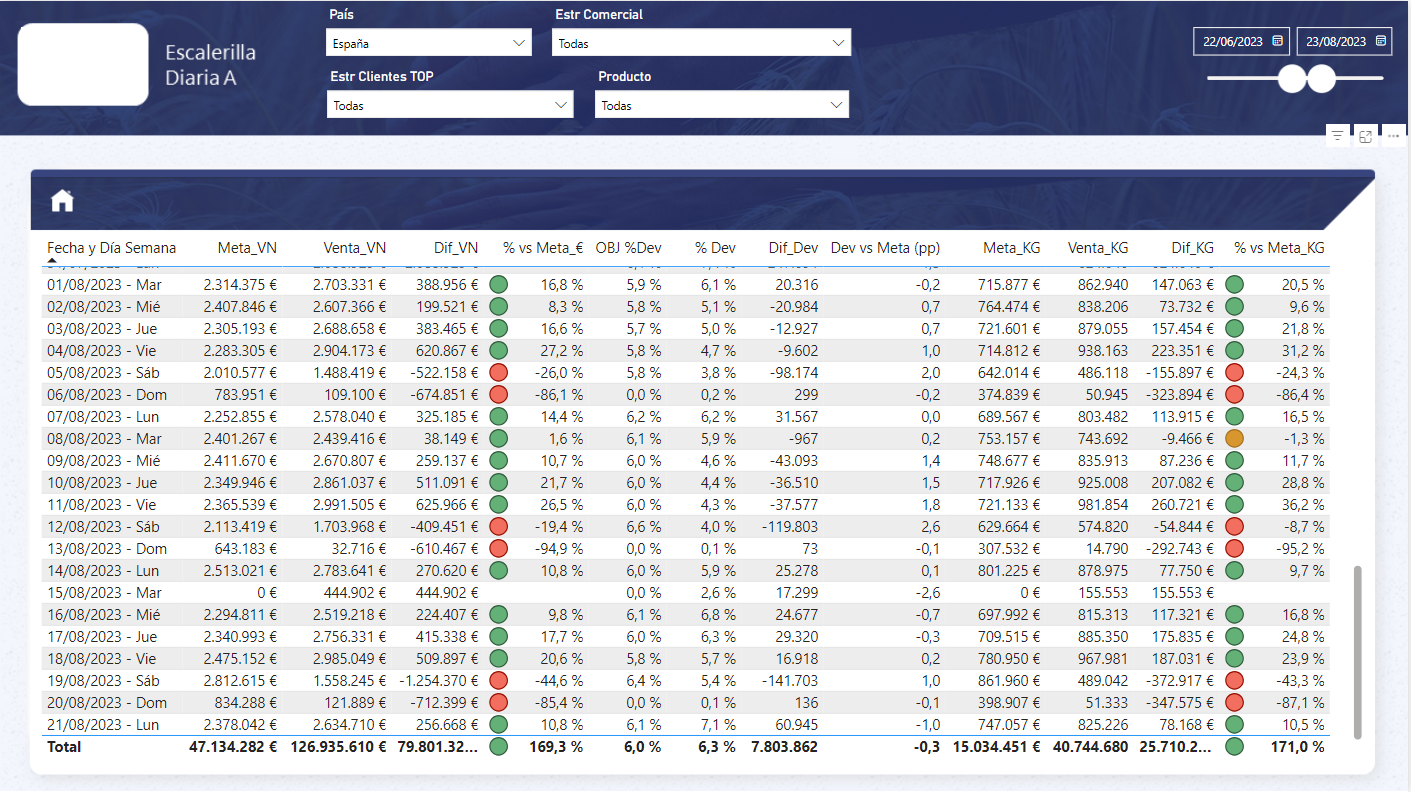
How to deploy a Commercial & Sales Dashboard using Power BI with Agile project methodologies,
allowing daily access for 440 users.
A comprehensive guide to building a dynamic data analytical commercial environment with Kettle, MySQL, and Power BI.
Accelerate CEO decision-making with Power BI insights
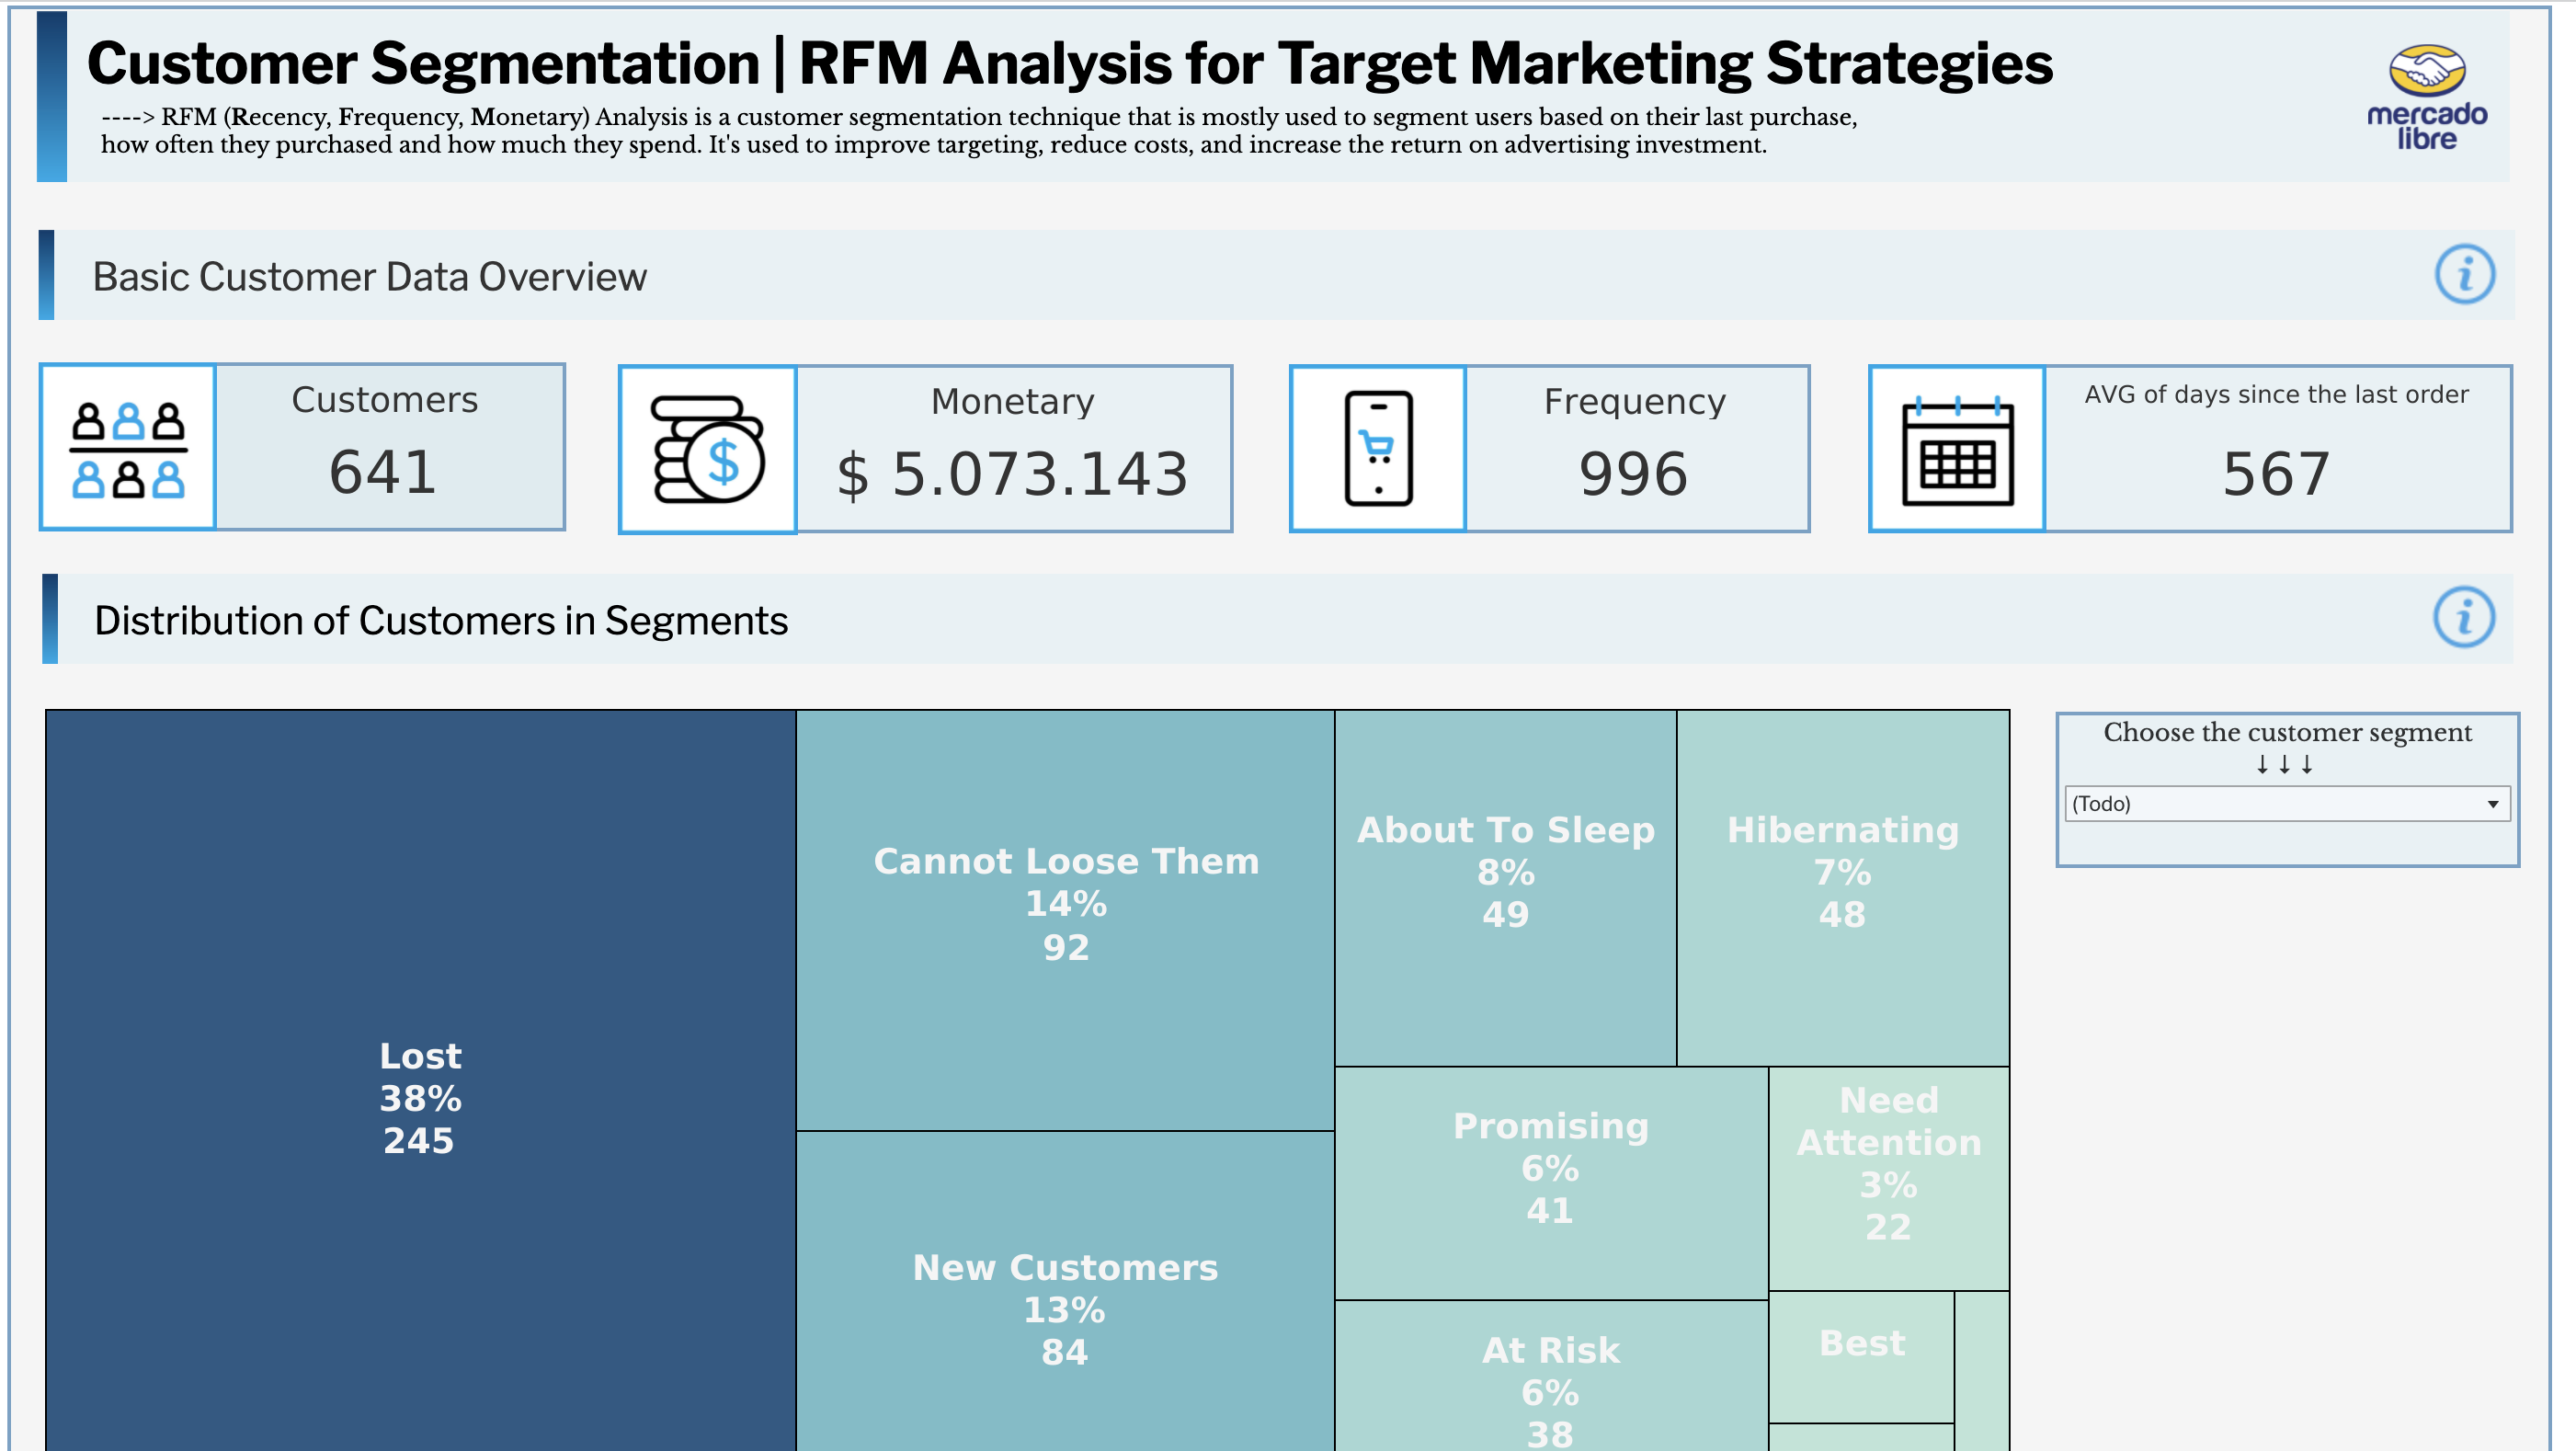
RFM (Recency, Frequency, Monetary) Analysis is a customer segmentation technique that is mostly used to segment users based on their last purchase, how often they purchased and how much they spend. It's used to improve targenting, reduce cost, and increase the return on advertising investment.
The goal of this team’s final project is to provide support to the Gender Violence Institute, with the analysis of the data collected from different programs and the implementation of a management tool. This dashboard has different KPIs that will allow for greater efficiency in the management of public investment in policies against gender violence.
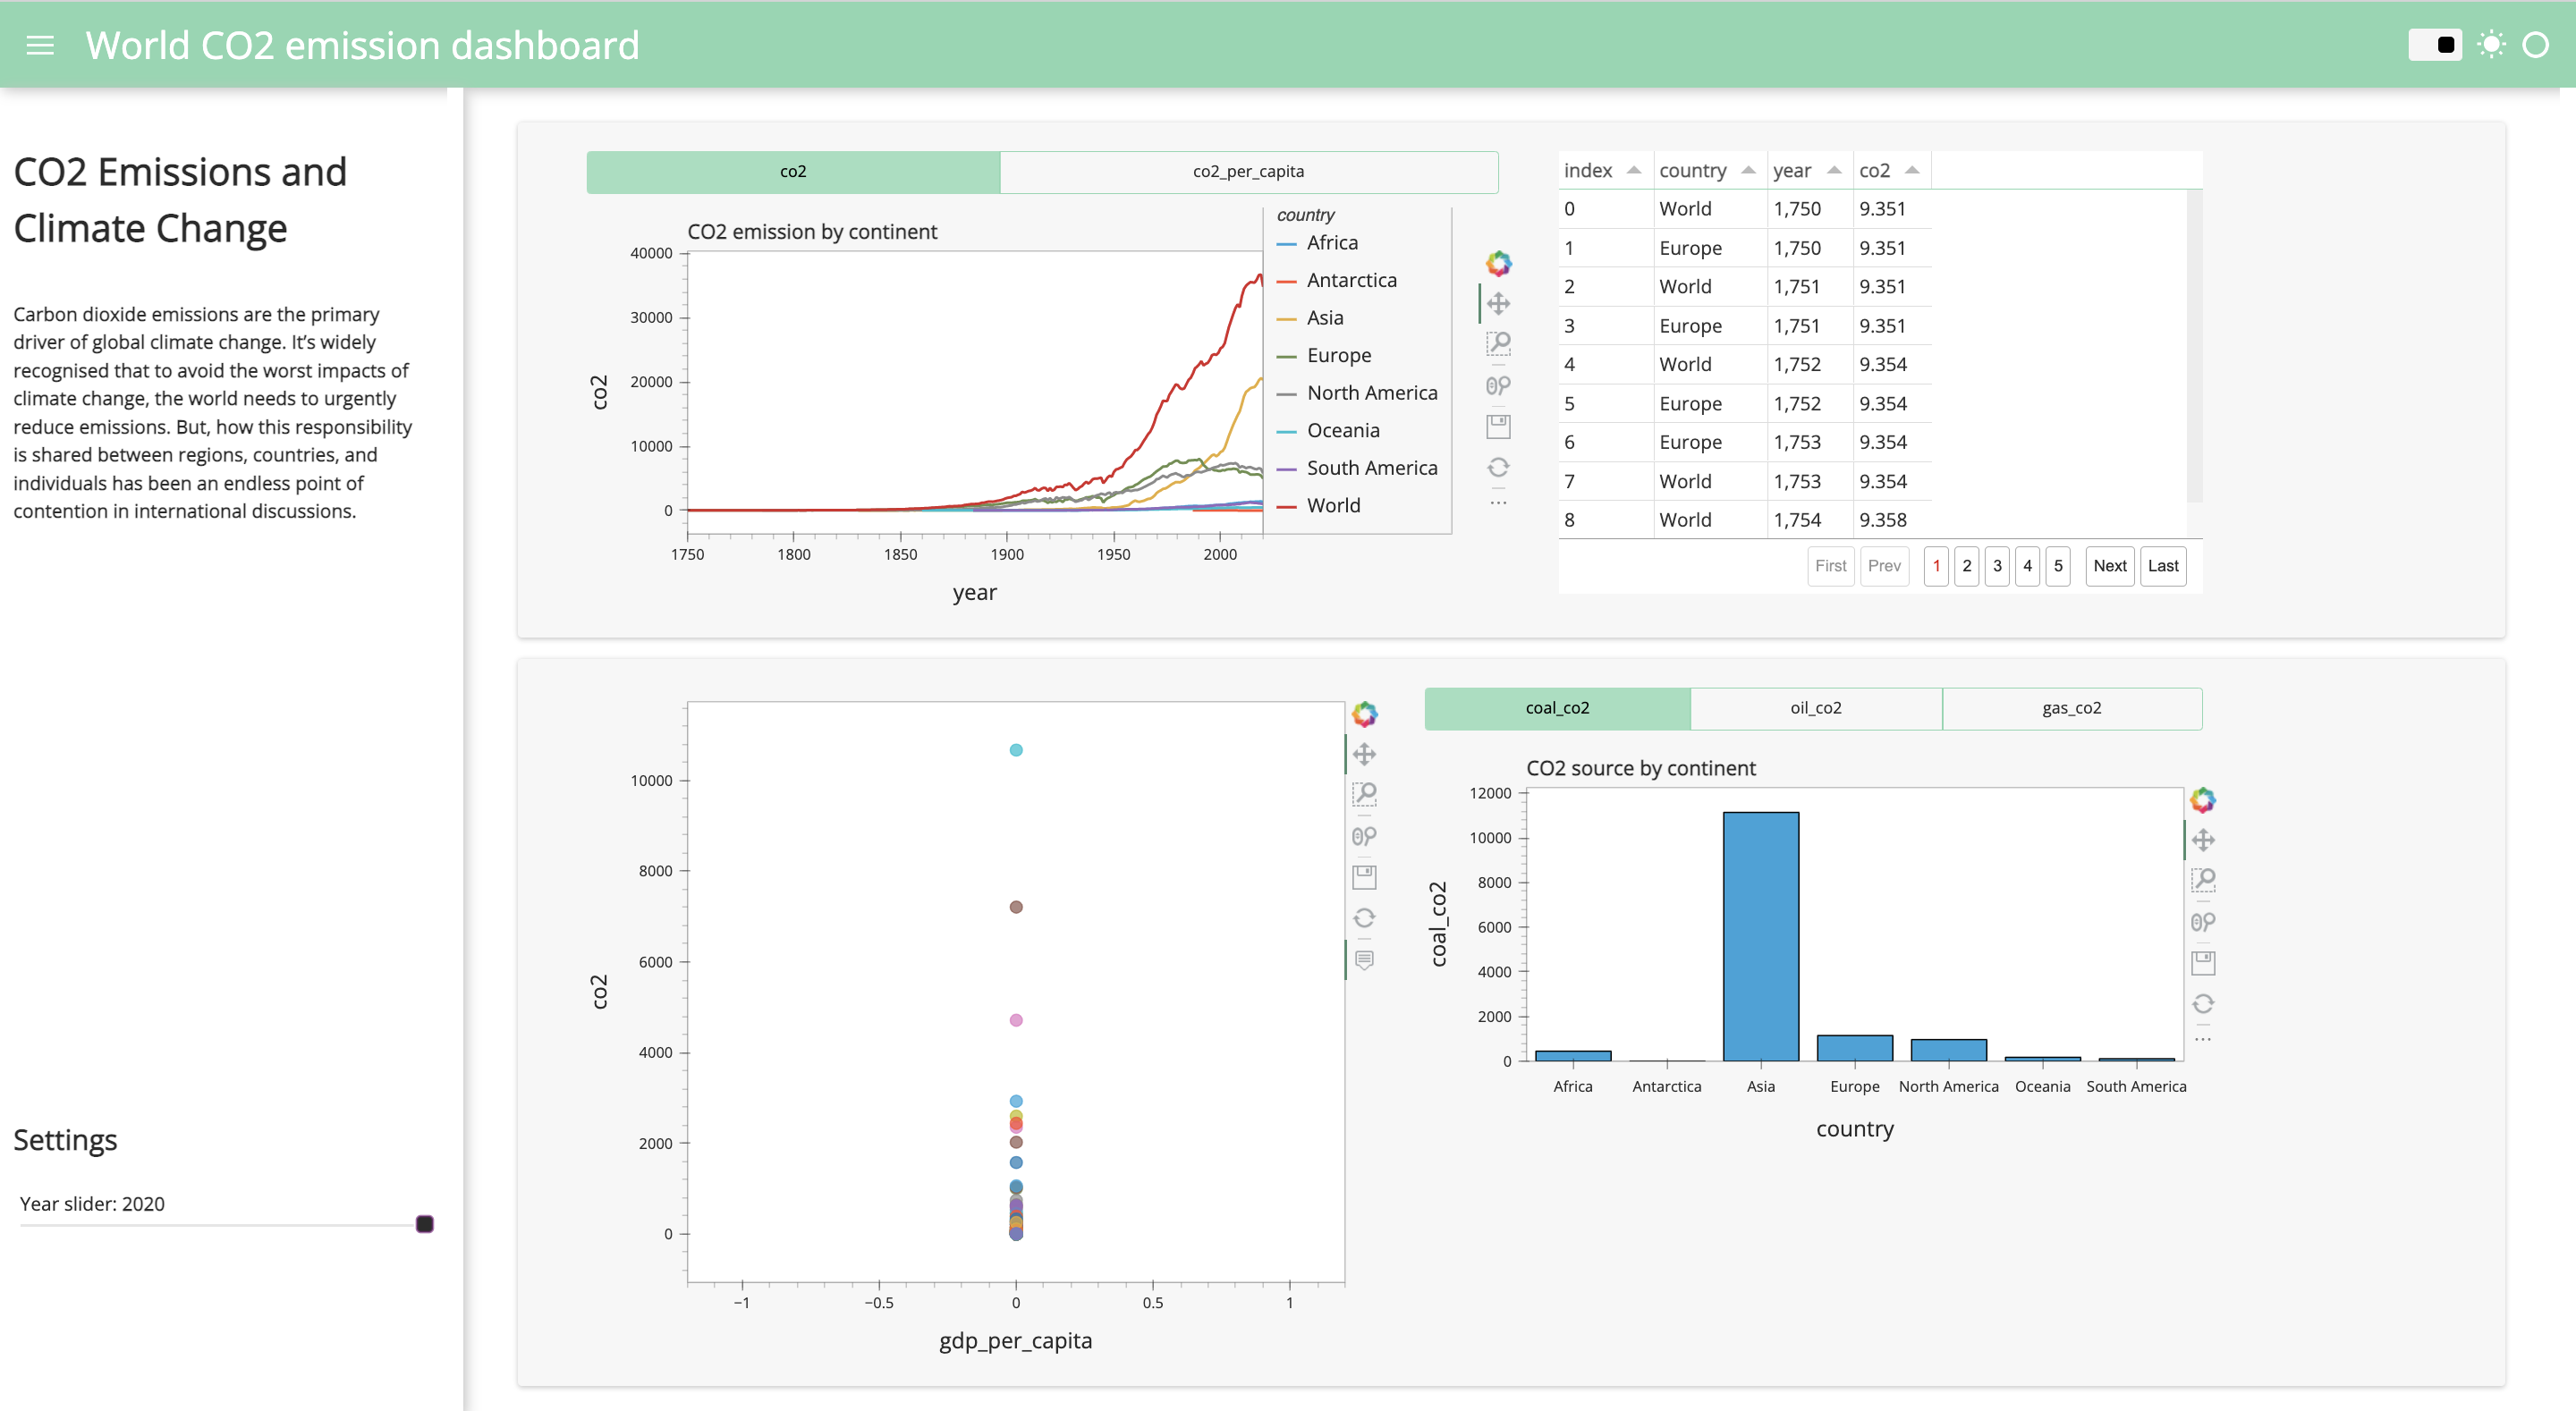
For this project, I worked with Jupiter Lab and import the packages Pandas, Numpy and Panel. The main challenge was to build an interactive dashboard with a good visualization of Carbon dioxide emissions, the primary driver of global climate change